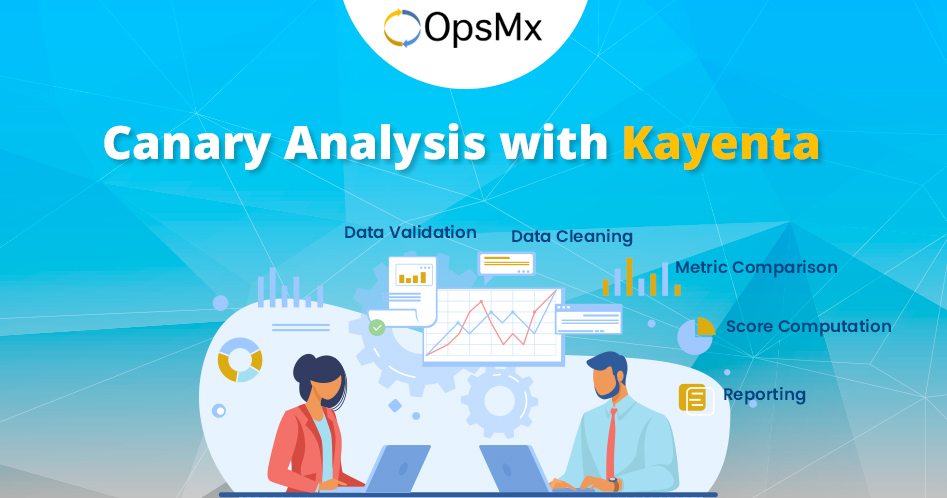
Overview of Canary Analysis using Kayenta for Spinnaker pipelines
In the previous article, “How to integrate Kayenta with Spinnaker for Automated Canary Analysis” we have described how to install, and enable Kayenta, the Spinnaker microservice that is responsible for executing the Canary release deployment and integrate it with Spinnaker. In this blog, we will discuss what is Canary Analysis and we will also look at the different stages of Kayenta. Further, we will also explore the best practices for configuring Kayenta to perform Automated Canary Analysis on Spinnaker pipelines.
Overview of Canary Analysis
A deployment process where any change is partially rolled out and then evaluated against the current deployment i.e. baseline to ensure the latest deployment is stable is called a Canary deployment. This evaluation is done using metrics that are selected when the canary is configured.
Overview of Spinnaker microservice – Kayenta
Kayenta is the Automated Canary Analysis (ACA) platform that comes as an inbuilt feature with Spinnaker. Kayenta is responsible for assessing the risk of a Canary release and checks for significant degradation between the baseline and Canary. Canary Config is not available on the Spinnaker UI by default. Users should check the Canary checkbox in the Application Config to activate Canary Config and Canary Reports on Deck. Kayenta supports Monitoring tools like Stackdriver, Prometheus, Datadog, New Relic, e.t.c. Kayenta consists of two stages – Metric Retrieval and Judgement.
Metric Retrieval
This stage retrieves the key metrics from the baseline and canary clusters. Where the metrics are usually stored in a time-series database with a set of tags and annotations that identifies the deployment data collected from canary/baseline.
Judgment
In this phase, Spinnaker compares those metrics and renders a decision to pass or fail the canary (i.e. was there a significant degradation in the metrics?) The judgment can also be configured to continue on with a canary when the result is “marginal.”
The judgment consists of four main steps, and they’re described below.
- Data Validation
- The goal of data validation is to ensure that, prior to analysis there is data for the baseline and canary metrics.
- In some cases, the metric is labeled as “NODATA” and moves forward to the next metric. This usually occurs when the collected metrics have an empty array for baseline/canary or both.
- Data Cleaning
- Data Cleaning majorly prepares the raw metrics for comparison. Which handles the missing values from the input. There are different strategies for handling missing values based on the type of metric. For example, missing values, represented as NaNs, may be replaced with zeros for error metrics while they may be removed for other types of metrics.
- Metric Comparison
- This stage handles the metrics comparison between the canary and baseline deployment data for the given metrics.
- Each metric will be classified as either “Pass”. “High” or “Low”.
- In case if the classification shows “High” this indicates that the canary and baseline deployment have significant degradation.
- Score Computation
- After each metric has been classified a final score will be computed. This score represents the similarity between the canary and baseline deployments.
- Reporting
- Since Kayenta is an inbuilt feature with Spinnaker. In the Spinnaker UI, there is a field under pipeline execution details which shows the canary score along with Timeline.
Best Practices to Configure Canary with Kayenta
- Do not add too many metrics in one group.
- Ensure to compare canary against the baseline, not with production.
- Run the canary for a longer duration.
- A retrospective analysis to make debugging faster
- Choose a reasonable canary threshold number
- Good starting points:
- A marginal threshold of 75
- Pass threshold of 95
- Good starting points:
- Choose appropriate metrics to analyze
So in this blog, you have learned about what are Canary Analysis and Kayenta, and you have also got a detailed overview of the different Kayenta stages – Metric Retrieval, and Judgment. Further, you have learned about the best practices to configure Canary on Kayenta. If you want to know more about these topics, please read our blog regularly and explore interesting articles on Spinnaker, CI/CD, Continuous Delivery, and so on.
If you want to know more about the Spinnaker or request a demonstration, please book a meeting with us.
OpsMx is a leading provider of Continuous Delivery solutions that help enterprises safely deliver software at scale and without any human intervention. We help engineering teams take the risk and manual effort out of releasing innovations at the speed of modern business. For additional information, contact us
