Extending Spinnaker Deck functionality for custom reports/dashboards
Spinnaker needs no introduction in the world of continuous delivery. It is widely used across the community for its ease of use and implementation and for its ability to perform multi-cloud deployments. While the Spinnaker CD pipelines are widely accepted & used for their rich feature set & functionality, it lacks in providing cumulative data reporting to its users based on the role the users play during the software delivery life cycle. Hence, a lot of users end up looking out for alternate solutions/tools that suffice their reporting needs. To know more about reports and dashboards in Spinnaker please read our blog post: Continuous Delivery Dashboard to monitor and measure CICD initiatives.
In this blog, we will focus on how we can extend Spinnaker functionality for cumulative data reporting/customer reports & dashboards.
Deck microservice runs the browser-based UI for Spinnaker. All the functionality with respect to UX for Spinnaker is managed by Deck. The inbuilt reports & their corresponding templates are all a part of this service. Customizing this service is the key to solving the problem of custom reports/dashboards.
Deck functionality is extensible to add a feature set on the header tab of Spinnaker, add a side menu, and define custom functionality with any kind of decision-based operations. We had a similar requirement, where we wanted to generate custom dashboards. The customer wanted their reporting to be uncluttered and quickly searchable, it should also easily reflect – who updated the artifacts, who did the testing, who executed the respective Spinnaker CI/CD pipelines, at what point did the errors happened and so on.
EXTENDING SPINNAKER DECK UI
There were two major requirements we had:
- We needed multiple custom dashboards.
- The corresponding changes to Spinnaker for creating these custom dashboards should be non-intrusive so that any patches/upgrades to Spinnaker should be a hassle-free activity.
We started out with creating a new module in Deck, named “custom features“. All of our customized code was in this single folder. The unique name ensured that there would be no naming conflicts with future spinnaker modules thus making sure that the code would be future proof.
We added a new tab “Custom Features” in the Header menu of Spinnaker UI.
Refer to the labels (points) 1 & 2 as mentioned in the screenshot above:
- Initially, we added an on-demand tab in headers (by name Custom Features in the above screenshot) which may be visible or hidden based on the flag present in setting.js.
- Represents a list of Additional Features available in Spinnaker that users can click on.
Clicking on any one of these features will take us directly to a detailed view of the selected feature as shown below.
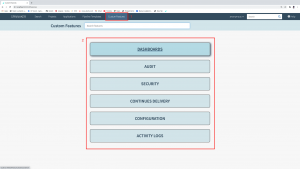
Custom feature page in Spinnaker
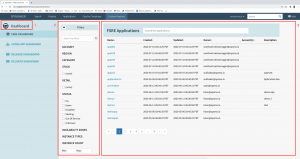
Detailed view of the Selected Feature
Refer to labels (points) 1, 2 & 3 as mentioned in the screenshot above:
- Represents the name of the “Selected Feature“. The menu items below represent the link of Sub-features.
- Represents the “Filters” section relevant to the selected feature.
- Represents the detail section of the selected feature.
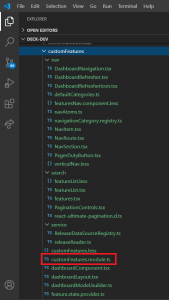
The folder structure of the Custom Feature Module.
The Custom Feature component is created at the same level as application, pipelines, etc. It represents the modules that are responsible for loading content of custom feature components either lazily or eagerly.
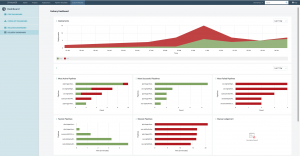
Spinnaker custom Continuous Delivery Dashboard
Finally, as shown in the image above, the custom Spinnaker Continuous Delivery Dashboard makes it easy for the DevOps teams to quickly identify and know which Spinnaker CD pipelines are most active, which ones are the most successful, which ones have failed, which ones are the fastest and which are the slowest. This is an example of the custom dashboard creation and you can choose to display data according to your own chosen metrics.
So in this blog, we had shown you how we at OpsMx extended the open source Spinnaker capabilities by configuring and adding a new custom feature set on the header tab of Spinnaker, added a side menu, and defined a custom functionality with any kind of decision-based operations as per the client’s requirement for generating custom report dashboards. This is how we created the custom reports/dashboards in Spinnaker UI using the Spinnaker Deck functionality. If you have similar requirements to add more custom features and functionalities to your Spinnaker, please feel free to contact us.
If you want to know more about the Spinnaker or request a demonstration, please book a meeting with us.
OpsMx is a leading provider of Continuous Delivery solutions that help enterprises safely deliver software at scale and without any human intervention. We help engineering teams take the risk and manual effort out of releasing innovations at the speed of modern business. For additional information, contact us at OpsMx Support.
