Demonstration of Continuous Verification with Autopilot in a Spinnaker CD pipeline
DevOps team spends hours alone in manually diagnosing, troubleshooting issues, or identifying the risk of a release in build, test, deployment stages to promote it to the production stage. This process of verifying a release is overwhelming and error-prone and delays the time to move software from code check-in to release. Continuous Verification is an automated process of continuous monitoring, verification, and validation of releases that aim at optimizing the entire release process while removing the risks. OpsMx Autopilot, an AI/ML-based continuous verification platform that provides continuous feedback to your DevOps team by finding bugs with the underlying cause of failures automatically and assessing risks in all the stages of CI/CD. AutoPilot uses AI and ML technologies to assess the risk of a new release, find the root-cause of issues and abnormalities for instantaneous diagnosis, and provide real-time visibility and insight about the performance and quality of new deployments to avoid business disruption.
Here is the video on the same topic:
Spinnaker CD Pipeline
Spinnaker is a multi-cloud Continuous Delivery (CD) platform. It enables faster releases of applications by joining the build, test, production deployment stages creating an end-to-end release pipeline.
It has three primary functions:
- Ability to create a pipeline by joining the different stages (build/ test/deploy)
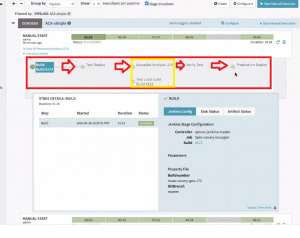
Spinnaker CD pipeline integrated with Autopilot
This is an example of how the pipeline Spinnaker looks with different stages joined end-to-end – Build, Test Deploy. Autopilot Analysis (Automated Verification of the Test Suite). By verifying the test results based on the score from automated analysis, you can finally promote the artifacts to Production Deploy. If the verification results are not satisfactory then the release is not promoted and is sent for further diagnostics.
- Multi-cloud integrations
Spinnaker provides abstractions for each of the clouds for deployment strategies like Rolling Update, Blue-Green, and Canary deployments that we can built-in. These cloud environments are natively-built with environment-specific features e.g. The features of AWS, are different from the features of Kubernetes (K8s). These functionalities are all built-in and take advantage of all the features that the cloud provides. We can then use the abstraction layers as a part of the delivery pipeline.
- Ability to manage your deployments
As you deploy your application it helps you to locate the current state of your application that is currently deployed and act on it based on the Rollback configured with Spinnaker.
Rollback Deployment in Spinnaker CD pipelines
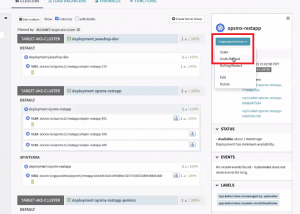
Rollback mechanism in Spinnaker CD
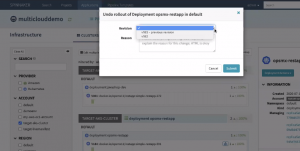
Undo the Rollout in Spinnaker CD pipeline
Spinnaker allows you to easily ‘Undo the Rollout’ and roll-back to a previous version (based on the amount of history you keep). As part of your pipeline if you do a Canary deployment and decode that the canary is not performing you can do a Rollback. It also helps you with the diagnosis errors with the services deployed.
Log Reports in Spinnaker CD pipelines
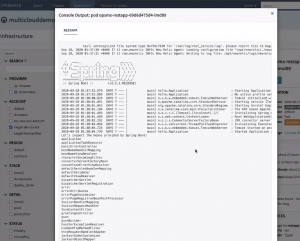
Console output logs in Spinnaker CD pipeline
You can check out the centralized log reports that get generated on a specific pod. You can choose to scale the deployment or even delete the deployment.
For automated verification, let’s say you have merged some code to the main branch and the code is now ready to be promoted to production. The code is built and deployed to the test, and automated analysis using Autopilot is done against the test cases. Based on the outcome you can decide whether to promote it to production.
Select Baseline parameters in Spinnaker CD pipelines
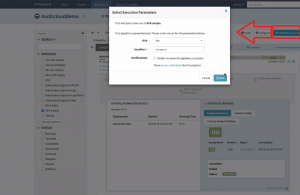
Select Execution parameters in Spinnaker CD pipeline
You can select the baseline parameters and configure them for automated judgment. Even after automated analysis, you can look at the analysis report and make a manual judgment to promote the production.
Canary Result in Spinnaker CD pipelines
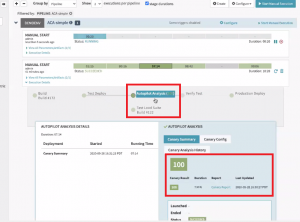
Autopilot Analysis & Canary Analysis result
Looking at the Canary result we can have a score between 0 and 100. Zero implies low confidence and that the code may not be promoted while a score of 100 implies high confidence (compatible with the previous version) and ready to promote to production. Most of the time when the result is successful you do not need any further diagnosis. But for the failure scenarios, you can further check the Canary Report and find responses to the failures quickly.
Canary Reports
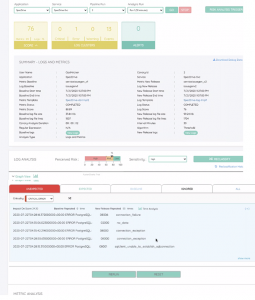
Canary Report in Spinnaker CD pipeline
Canary reports can be used to quickly identify what the issues are. It does the analysis both for logs and metrics and displays them separately. The analysis is done for over 100 KB of data for the period during which log reports are generated. If you click on the ‘View Logs’ link it takes you to an external system like Elasticsearch that you are already using to collect the log information. In the log details of the 100 KB of data, the lines of data form a cluster together. We use NLP (natural language processing) to identify the log lines that form clusters both in terms of similarity as well as closeness to each other. It then classifies them as errors or information and based on that classification it computes a score. The score results are then used for making further analysis and decisions whether or not to promote production.
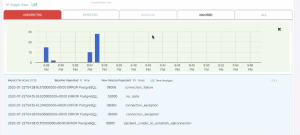
Timeline Analysis of Tests
We can also see the timeline of the test where these errors occurred. In this example, when we looked at the first five minutes of test data we found the system did multiple retries indicating that there were some network configuration issues at the beginning but it had recovered afterward. So we can ignore this issue.
Log Metrics in Spinnaker CD pipelines
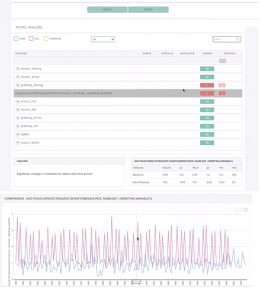
Log metrics data in Spinnaker CD pipelines
When we look at the log metrics data for the services which can be application-level metrics or system-level metrics (data coming from OS/memory/CPU) as well as the system latency. In this example, the latency report showed that there were database latency issues. It was a transient issue with an acquired configuration and there was a network configuration issue (routing problem) with the VPC. We could thereby quickly resolve the issue after the problem was identified.
Log analysis for multiple services
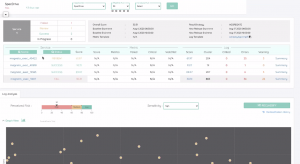
Log Analysis in Spinnaker CD pipelines
Here you can run multiple services of the application, correlate their errors, and identify the failure due to dependencies or changes that are affecting the system.
So now we are able to deploy to the test environment, run automated analysis beyond the test cases, Sometimes there might be incomplete test cases, and some test cases can not be completely automated for 100% test coverage, particularly for integration environments. So using Autopilot gives you an added benefit for these instances where you can verify your deployment without having to do any additional coding. It gives you higher confidence to promote your software artifacts into production.
If you want to know more about the Autopilot or request a demonstration, please book a meeting with us.
OpsMx is a leading provider of Continuous Delivery solutions that help enterprises safely deliver software at scale and without any human intervention. We help engineering teams take the risk and manual effort out of releasing innovations at the speed of modern business. For additional information, contact us
