Debugging Build Failures with Autopilot
Continuous delivery is not continuous if the build process and the debugging of build failures take a long time. The plethora of build automation tools and continuous integration tools have brought significant progress in the build process over time. However, still, there are gaps in how we debug build issues at scale. More time spending on identifying build issues can have a significant impact on time to market software and developer productivity.
Build automation in a development setup needs to cater 100s of builds in a day. Modern build environments use a build daemon, which runs builds in containers. The build steps include running a build container, launching the build, and shutting down the build container. The build automation servers could be On-demand automation such as a user running a script at the command line, Scheduled automation such as a continuous integration server running a nightly build, or Triggered automation such as a continuous integration server running a build on every commit to a version-control system. Automation is achieved using a compile farm for either distributed compilation or the execution of the utility step.
Build tools may produce different types of errors and warnings. Commonly occurring build error categories are Dependency Errors, Type Mismatch, Syntax, and Semantic errors. Besides, there could be errors linked to the infrastructure. Typical time to fix a single build error varies from a few minutes to up to an hour. Build automation catering to a large number of builds in a day can produce enough errors to consume several hours of effort of operations engineers and developers.
Because of the very nature of build automation optimized for building infrastructure, manual debugging of build issues is not scalable for large setups. Below are some of the challenges:
- Most companies generate 1000’s of builds per day. Assessing where a build has failed and if the failure is due to infrastructure error is difficult. So doing it manually will create friction to scale.
- Multiple-components to look at to learn about the failure, it takes excessive time to diagnose failed builds.
- Experts are required to analyze logs and these experts are expensive and in short supply.
- Time-consuming diagnostics create a loss of development productivity.
- Lack of management visibility and Insights.
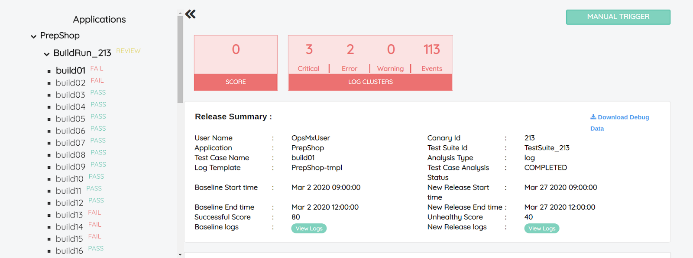
OpsMx’s Autopilot provides the capability to quickly zero-in on build issues at scale. The software can scan through the logs of 1000’s of builds and point to the root-cause of failed builds in a jiffy. Please refer below mentioned Autopilot components used for debugging build failures:
1. Build Assessment: Aggregated assessment of Logs
OpsMx Autopilot can capture and assess logs from multiple sources, including build logs, Infrastructure logs, and service logs, and the results are presented in the analysis screen. Results can be grouped in collections that help in quick isolation of failed builds. Intuitive UI with Graphical representation of error classes in a scatter graph increases team visibility and fast triaging of failures.
2. Diagnostics: Identifying build issues & providing detailed Log View
Detailed log view in Autopilot provides instant access to important log events, eliminating the need to sift through massive log files. Deduplication and clustering of related events enhance the visibility and reduce the clutter. The error events can be filtered through predefined or user-defined categories to reduce analysis time. The user can teach the system for the kind of events he wants to see, and the system can evolve over successive analysis runs. The unexpected log events can be reclassified to reduce the number of false positives. Multiple log streams can be analyzed together to establish correlations.

3. Build visibility: Easy visibility to 100s of builds
With Autopilot, one can quickly identify, and aggregate failed builds. It also shows the build metadata such as latency information for build stages, resource usage of the build container in a convenient way. Custom event tags for the build help in reducing noise and analysis time.

4. Build Insights: Analyze historical build data and identify the point of friction
Using Autopilot, Operations engineers can look at the historical build data to find useful patterns in the build process. A number of builds passed/failed in a time interval, statistical info on build time, Error tags for failed builds, etc., are available as part of the build Analytics.


BENEFITS
- Improve developer productivity by automating build failure assessment
- Reduce time to triage by 75% with faster way of diagnosis by interacting with multiple components
- Reduces the dependency on experts who are required to analyze logs by leveraging Autopilot’s machine learning
- Improve operational efficiency through management visibility and historical Insights
CONCLUSION
The software build is a core activity in software development and is performed multiple times in a day by the developers. Multiple build iterations are common to fix build errors. Tremendous efforts spent in debugging build issues point towards the need for proactively analyzing data coming from various sources for fast triaging. The use of assistive tools such as Autopilot to identify and resolve build errors can pay off quickly by enabling faster time to market and improved developer productivity.

