How to integrate Kayenta with Spinnaker for Automated Canary Analysis
In this blog, we will explore how to integrate Kayenta with Spinnaker to scrape metrics from Prometheus and perform Automated Canary Analysis in your CI/CD pipeline using the Spinnaker pipeline.
We expect the reader to have a basic understanding of how Spinnaker works as a Continuous Delivery tool and orchestration platform for deploying new software application releases, new feature updates, change requests, or bug fixes. We also expect that you know how to create CI/CD pipelines with Spinnaker.
Further, you should have a basic understanding of what is Canary Deployment and Canary Analysis. For the uninitiated greenhorns, Canary Analysis is a type of deployment process where any change in the software application (change in code and/or configuration) is partially rolled out to a small subset of users before making it available to everybody. The new Canary deployment is evaluated against the current deployment (baseline) to ensure the latest deployment is stable. This evaluation is done using metrics that are selected when the Canary is configured in a Spinnaker pipeline. For detailed understanding read here.
Application monitoring (APM) tools like Prometheus, Datadog, NewRelic, etc. collect and store comprehensive performance metrics in a time-series database and provide telemetry to the Spinnaker microservice, Kayenta.
Kayenta is the Automated Canary Analysis service that integrates tightly with Spinnaker and uses the performance metrics to make Canary judgment whether the release is fit for production or it needs to be rolled back.
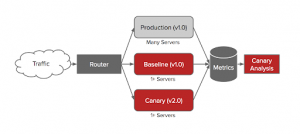
Netflix Canary Release Process (Source: Netflix Blog)
Prerequisites
- Active Kubernetes/OpenShift clusters which have the capacity to handle Spinnaker, Kayenta, and Prometheus.
- Minio database to be used as persistent storage to store all the Spinnaker and Kayenta metadata.
- Ensure to install Spinnaker and Prometheus
. - Configure Spinnaker with Prometheus.
Steps to configure Spinnaker for Automated Canary Analysis
Spinnaker installation using Halyard
Instructions are provided assuming that your Spinnaker installation is done with Halyard.
- Login to the halyard container.
kubectl -n hal exec -it spinnaker-1591961606-spi-halyard-0 bash - Execute the below command to Enable Canary deployments to get them available in the UI.
hal config canary enable - Configure Canary to use Prometheus as a source of metrics.
hal config canary prometheus enablehal config canary prometheus account add my-prometheus --base-url <PrometheusEndPointURL:Port> - Execute the below commands to configure Canary to use Storage. Since I have used helm charts to install Spinnaker (Read Deploy Spinnaker to Kubernetes using HELM charts), I have Minio database already, using the same instance that stores the Spinnaker configuration.
hal config canary aws enablehal config canary aws account add my-minio --bucket spin-bucket --endpointhttp://spinnaker-1591961606-minio:9000 --access-key-id <MinioAccessKey> --secret-access-key #At prompt Provide <Minio Secret Key>hal config canary aws edit --s3-enabled true - Set defaults for the Created accounts.
hal config canary edit --default-metrics-store prometheushal config canary edit --default-metrics-account prometheushal config canary edit --default-storage-account my-minio - Execute the below command to enable mine-canary
hal config features edit --mine-canary=true - Now, restart the Spinnaker Services by executing the below command
hal deploy apply
- After completing the above user should be able to see the Kayenta container as available and running as shown in the below screenshot.
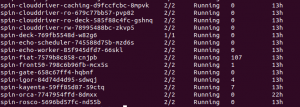
Kayenta container is running and is available
|
Note: Spinnaker Services will show 2/2 only if you have Prometheus Monitoring enabled for Spinnaker Services. |
Steps to configure Canary
Canary Config is not available on the Spinnaker UI by default. Users should check the Canary checkbox in the Spinnaker’s Application Config to activate Canary Config and Canary Reports on Deck. Wherever you need Canary Analysis, you need to select the canary checkbox option in Spinnaker.
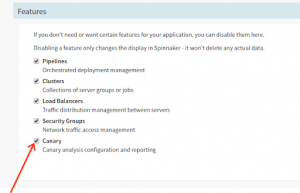
Options to select which Spinnaker Features to be displayed
Configuring Canary in Spinnaker
- Now, let’s create Canary Config. You can create as many of these as you like, and whenever you create a Canary stage, you must select a Canary configuration to use. Configurations you create within an application are available to all pipelines in that application, but your Spinnaker might be set up so that all configurations are available to all applications.
- Click on the Canary Config > Add Configuration
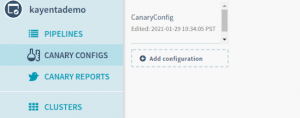
Add Canary configuration for the Canary stage
- Now, provide a Name for your Canary Config. which will be shown in your pipeline Canary stage.
- Create Metric Groups and add metrics. You can create any groups you want to organize the metrics into.
- In the Metrics section, select Add Metric > Give a name to the Metric.
- Specify whether this metric fails when the value deviates too high or too low compared to the baseline.
- Identify the specific metric you’re including in the analysis configuration:
- In the Metric Type field type at least 3 characters to populate the field with available metrics. As per the below screenshot.
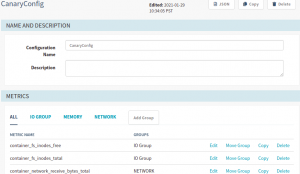
Insert Canary Config name
- In the Metric Type field type at least 3 characters to populate the field with available metrics. As per the below screenshot.
- Now, create a Filter Template to scrape the necessary metrics for your analysis.
- Click on Filter Template dropdown and select “Create new”.
- Now, insert the query to scrape the metrics for analysis.
For example, refer to the screenshot below

Create Filter Templates
- Scoring – Ensure the Metric Group Weights should always sum up to 100. Refer to the screenshot below
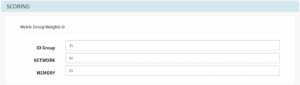
Ensure Metric Group Weights adds up to 100.
Add Canary Analysis stage to the Spinnaker pipeline
- Once you have enabled Canary for your application and created Canary configurations. Now it’s time to add the canary stage to your pipeline to perform canary analysis for your deployment.
- This Canary stage can perform over data points collected beginning from the moment of execution and into the future, or it can be performed over a specified time interval.
- Sample Spinnaker pipeline structure created for this blog
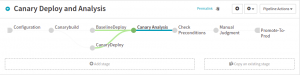
Sample Spinnaker pipeline structure
- Post completion of deployment stages add Canary Analysis stage. Your Canary and baseline analysis reports will be accurate only if the below fields are filled with appropriate values.
- Analysis Type
- Real-Time – This analysis happens for a specified period of time. The time the stage begins to execute depends on the Delay. Ensure to specify the number of hours for the real-time to perform analysis.
- Retrospective – Analysis will be performed over a period of time. Typically, this is done for a time period in the past, against a baseline deployment and a Canary deployment which have already been running before this Canary Analysis stage starts
- Now, let’s begin to declare the analysis configuration. Insert values to the following fields.
- Select the Config Name created in Canary Config.
- LifeTime (Provide maximum duration to get accurate comparison)
- Delay
- Interval (Based on your Lifetime, Suggested duration is 30mins)
- Baseline Offset
- Lookback Type, select Growing/Sliding based on the requirement.
Refer to the screenshot below:
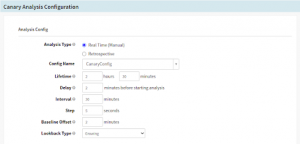
Canary Config (contd.) – Select or Insert config stage details
- Analysis Type
- Select Baseline + Canary Pair
-
- Baseline – The server group to treat as the “control” in the canary analysis.
- Baseline Region – The region where your baseline is deployed(NameSpace)
- Canary – The server group to treat as the experiment in the analysis.
- Canary Region – The region in which that canary server group is deployed.
Refer to the Screenshot below:
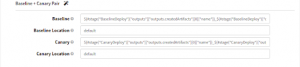
Canary Config (contd.) – Insert Canary and Baseline values and location
-
- Scoring Thresholds
These thresholds will be populated based on the configurations done in the canary configs. But can be overridden by providing the “Marginal” and “Pass” inputs.
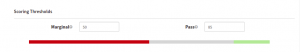
Configure Scoring Threshold violations and insert values for “Marginal” and “Pass”
- Now, Save the changes and execute the pipeline. You will have your canary analysis Preview in the Pipeline “Execution Details”
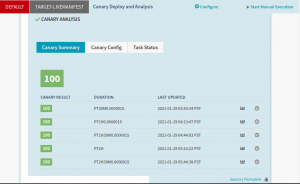
View Canary pipeline “Execution Details”
- Detailed scores and graphs can be found when you click on the Small Graph icon for your execution.
This is how you can configure a simple canary analysis in Spinnaker with Kayenta.
If you want to read more about Spinnaker, Kayenta, and Automated Canary Analysis (ACA) we have some interesting articles for further reading:
- What is Canary Deployment ?
- OpsMx adds Automated Canary Analysis for Kubernetes and Prometheus with Kayenta
- Spinnaker Meetup – Learn about Automated Canary Analysis
- Automated Canary Analysis Featured in Spinnaker Summit 2017
- Participate in Pilot of Automated Canary Analysis Platform
- Improve Release Safety and Diagnostics Through Automated Canary Analysis for Spinnaker
- Canary Deployment Gaining Momentum Across AWS Services
- How to Set Up Automated Release Analysis in Spinnaker Deployments
- Spinnaker 1.1 Enables Canary/ACA Stage for Safe Deployments
- How to Enable Prometheus Monitoring for Kubernetes Cluster
If you want to know more about the Spinnaker or request a demonstration, please book a meeting with us.
OpsMx is a leading provider of Continuous Delivery solutions that help enterprises safely deliver software at scale and without any human intervention. We help engineering teams take the risk and manual effort out of releasing innovations at the speed of modern business. For additional information, contact OpsMx Support.