Automate decision-making in CD pipelines using Autopilot
Background
While deploying applications at high velocity with Spinnaker, there is no room for compromising on the quality and safety of the deployed applications. DevOps team spends hours alone in identifying risks, diagnosing, and troubleshooting issues in the build, testing, deploy, or production stages of the CI/CD process. The manual process is error-prone and involves enormous efforts as one has to go through machine data manually, delaying the time to move the application from code check-in to release through any Continuous Delivery (CD) pipelines. To mitigate these challenges DevOps developers, testers, and SREs use the OpsMx Autopilot platform for continuous verification process across continuous delivery pipelines to track the bugs and resolve them at the earliest.
Real-time monitoring of deployments either in build, deployment, test, and production generates logs and metrics data. Using AI/ML technologies these data are then analyzed for errors and deviations from standards, and tagged with a confidence score validating the health of the release. Based on the confidence score, you can make intelligent, automated decisions about the release readiness and take a decision on whether to promote the release or not. To know more about how continuous verification of deployments, please read the blog here.
In this blog, we will discuss how you can use the OpsMx Autopilot platform for Continuous Verification and automated decision-making to promote your software update to the next pipeline stage by analyzing the logs at the end of the automation test run. You can integrate Autopilot as a REST service to trigger your analysis
You can also check the video on the same topic here.
UseCase: Risk Analysis and automated verification of Spinnaker CI/CD pipeline stages using Autopilot
The risk analysis phase for the release artifacts in your Spinnaker pipeline gets manually triggered by running a script. The script will display the URL where you can view the progress of the analysis. Spinnaker CI/CD pipeline gets manually triggered by running a script.
The analysis takes a couple of minutes.
Risk assessment of your release
After the analysis is complete, the analysis result appears on the screen. You can see the status of the analysis as failed with a risk score ‘Fail’ as zero, indicating a high risk for the software release. Autopilot has identified six new critical errors that have come up with the current test run compared to the previous test run. The risk score and the error count here can be used for automated decision-making for promoting the software to the next pipeline stage using Autopilot’s webhooks. The different errors are categorized into different categories – Critical, Errors, and Warning. They are graphically represented using a bubble graph (refer to the image below).
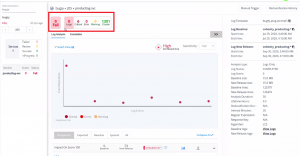
Risk Analysis of Spinnaker CI/CD pipeline is completed
By clicking on the individual bubbles you can see what specific error/issue has occurred in the current run.
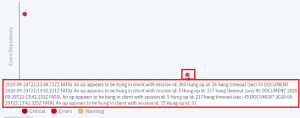
View Specific Errors in the Spinnaker CI/CD pipeline execution
You can also see the detailed log of this error below the graph. Here the operation is hung as timeout happened after forty-five seconds.
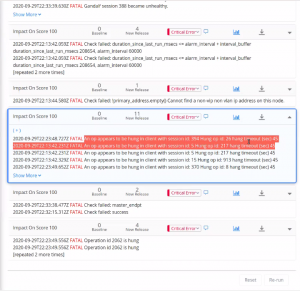
View Error Logs in the Spinnaker CI/CD pipeline execution
Trend analysis of risk scores
In addition, you can analyze the health of your software over a period of time using the trend analysis feature. You can track how the risk scores are varying and the error counts are changing over a period of time using the trend analysis.
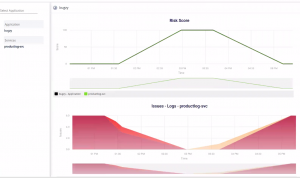
Trend Analysis indicating the health of your software to be deployed
You can also zoom in on any part of the graph to see the details. If you want to see the errors in a particular test run you can do that by navigating the analysis screen.
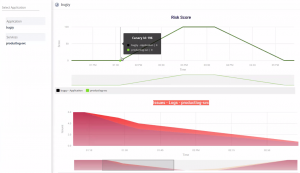
Zoom in the Autopilot Trend Analysis report for Spinnaker CI/CD pipeliens
Automated verification dashboard for Spinnaker CI/CD pipelines
Here, for the log error example, we have shown the canary id as “196”. So after you open the analysis screen you can enter this id in the textbox and see details of the error.
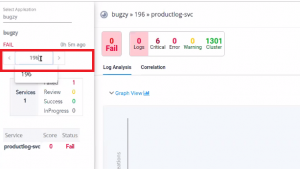
Navigation of the Autopilot Analysis Screen
Conclusion:
The above example is one of the common use cases in Fortune 500 companies, which leverage AI/ML to track the performance and quality of their release in every stage of their deployment. Enterprises implement Autopilot to make their CI/CD intelligent. Autopilot gathers data from various CI/CD tools for analysis. It can verify the risk of release and take automated decisions to progress pipelines. It uses its sophisticated algorithms to help developers, testers, and SREs to find regression in builds, test cases, and production rollouts respectively. It also provides real-time visibility to aid the release managers for fast-track approvals of the pipeline.
If you want to learn more or request a demo, please book a meeting with us. You can also simply get a free trial to explore the power of autopilot test verification.
OpsMx is a leading provider of Continuous Delivery and Continuous Verification solutions that help enterprises safely deliver software at scale and without any human intervention. We help engineering teams take the risk and manual effort out of releasing innovations at the speed of modern business. For additional information, contact us
